Not all scratch cards are created equal. Behind the colorful designs and exciting themes lies a mathematical reality that varies dramatically between games, operators, and price points. Understanding these differences can mean the distinction between reasonable entertainment value and throwing money into a black hole. This comprehensive analysis examines actual odds across scratch card categories, revealing which games offer the best chances and which should be avoided.
Understanding RTP: The Mathematics Behind Scratch Card Returns
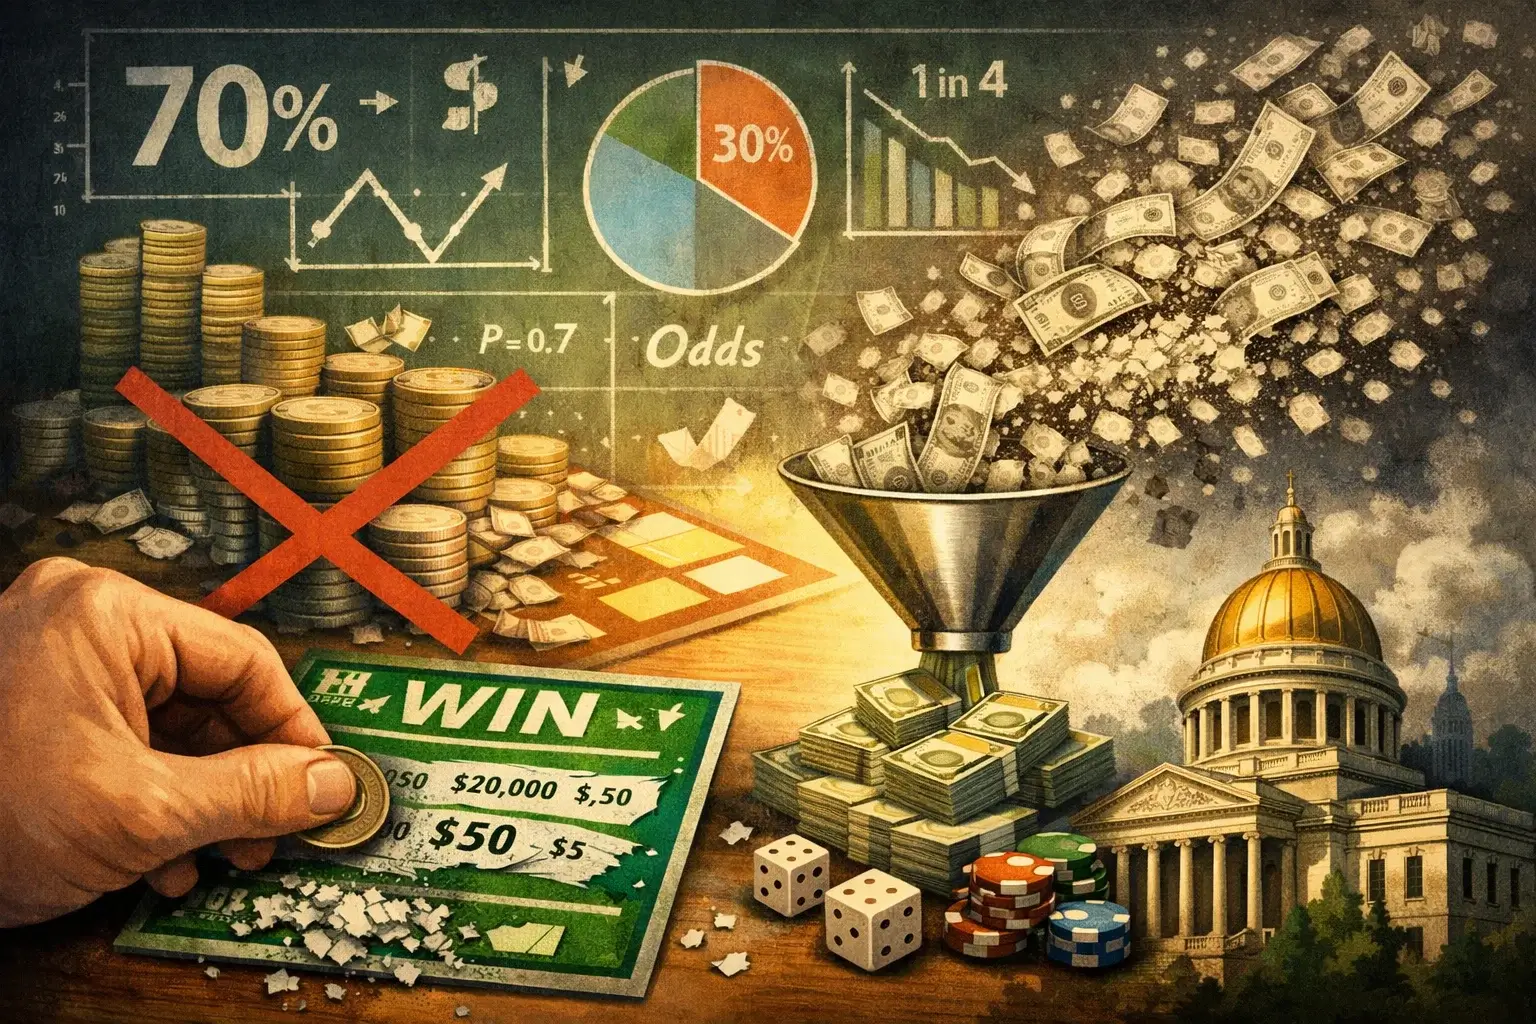
Return to Player (RTP) percentage represents the fundamental metric for evaluating scratch card value. This figure indicates how much money wagered gets returned to players over time, expressed as a percentage. A scratch card with 70% RTP means that for every $100 spent collectively by all players, $70 returns as prizes while $30 becomes operator profit.
The mathematical reality underlying RTP calculations is straightforward but often misunderstood by players. When a lottery organization prints 1 million scratch cards at $5 each, they collect $5 million in total sales. If the prize pool totals $3.5 million across all winning cards, the RTP equals 70% ($3.5M divided by $5M). The remaining $1.5 million covers printing costs, retailer commissions, administrative expenses, and lottery profit supporting government programs.
Individual player experience inevitably varies from theoretical RTP due to variance and sample size. Playing ten cards tells you virtually nothing about actual RTP—you might win nothing or hit a major prize, neither outcome reflecting the true return percentage. Meaningful RTP assessment requires hundreds or thousands of plays to approach statistical significance. This mathematical reality explains why players consistently overestimate their winning frequency based on limited personal experience.
RTP differs fundamentally from odds of winning. A game might offer 1-in-4 odds of winning something while maintaining only 65% RTP. This occurs because most “wins” return less than the purchase price—winning $2 on a $5 card counts as a win statistically but represents a net loss economically. The psychological impact of frequent small wins obscures poor overall returns, a design feature operators exploit deliberately.
Prize distribution patterns significantly affect practical playing experience despite identical RTPs. Consider two games, both with 75% RTP: Game A offers frequent small wins (1-in-3 cards wins $1-5) but rare large prizes. Game B offers rare wins (1-in-10 cards) but larger average prize amounts. Both return 75% mathematically, but playing experiences differ dramatically. Game A provides regular reinforcement maintaining engagement, while Game B creates long losing streaks punctuated by meaningful wins.
Regulatory requirements for RTP disclosure vary wildly across jurisdictions. Some states mandate prominent RTP publication, others require disclosure only in technical documentation, and many require no disclosure whatsoever. This information asymmetry disadvantages players attempting informed decisions. Even when disclosed, RTP figures often hide in fine print or technical specifications that casual players never examine.
The house edge represents the inverse of RTP—if RTP equals 75%, the house edge equals 25%. This 25% edge dwarfs typical casino game edges: blackjack ranges from 0.5-2%, roulette approximately 2.7-5.26%, and even slot machines typically maintain 2-10% edges. Scratch cards’ 25-40% edges represent among the worst odds in legalized gambling, a fact operators don’t advertise prominently.
Variance measures result volatility—how wildly outcomes fluctuate around the mean. Low-variance scratch cards produce consistent small returns with few significant prizes. High-variance games produce mostly losses with occasional large wins. Players preferring steady entertainment value should favor low-variance games despite identical RTPs to high-variance alternatives. Unfortunately, variance information rarely receives disclosure, forcing players to infer volatility from prize structure analysis.
State Lottery vs Casino Scratch Cards: A Shocking Odds Comparison
The odds difference between state lottery scratch cards and casino instant-win games represents one of gambling’s most dramatic disparities. Understanding these differences is crucial for players assuming scratch cards offer comparable value regardless of operator.
State lottery scratch cards typically maintain RTP percentages of 60-70%, making them among the worst gambling propositions legally available. Take the Massachusetts State Lottery as a representative example: their $1 scratch cards return approximately 67% to players, $2 cards return 68-70%, $5 cards reach 70-73%, and premium $20-30 cards approach 75-78%. These figures are actually generous compared to many states where RTPs hover around 60-65% across all price points.
The New York Lottery publishes comprehensive odds data revealing the harsh mathematical reality. Their $1 “Set For Life” scratch card offers 1-in-4.71 odds of winning anything, which sounds reasonable until examining prize distribution: 92% of wins return exactly $1 (breaking even), 6% return $2-5, and only 2% exceed $5. The top prize of $5,000 annually for life has 1-in-2,167,200 odds—worse than being struck by lightning.
Pennsylvania Lottery data demonstrates how price points affect returns. Their $1 tickets average 65% RTP with 1-in-5 overall odds. $5 tickets improve to 70% RTP with 1-in-3.8 odds. $20 tickets reach 76% RTP with 1-in-3.2 odds. Premium $30 tickets peak at 78% RTP with 1-in-2.8 odds. This tiered structure incentivizes higher-denomination purchases, though even “improved” odds remain poor compared to casino alternatives.
Casino scratch cards—both physical and digital—typically offer dramatically better returns. Online casino instant-win games average 85-96% RTP, comparable to slot machines rather than lottery products. NetEnt’s “Scratch Ahoy” returns 96%, Microgaming’s “Cool Buck” offers 95.5%, and Playtech’s “Jackpot Jester” maintains 94.7%. These figures represent 20-30 percentage point advantages over state lottery equivalents.
This enormous disparity stems from operational differences and institutional purposes. State lotteries function as government revenue mechanisms, mandated to generate substantial profits funding education, infrastructure, and social programs. Casino operators compete for customers in crowded markets, requiring competitive odds to attract players. Digital casinos eliminate printing, distribution, and retailer commission costs, enabling higher prize allocations.
Physical casino scratch cards occupy a middle ground. Las Vegas casinos offering proprietary scratch cards typically provide 75-85% RTP—better than state lotteries but inferior to online alternatives. These physical casino cards remain relatively rare compared to ubiquitous lottery tickets and digital casino games, representing a niche product in specific gambling destinations.
Regulatory frameworks create these odds discrepancies. State lottery regulations typically mandate minimum profit percentages—often 30-35% of gross sales—explicitly designing lottery products as taxation mechanisms disguised as entertainment. Casino gaming regulations instead mandate maximum house edges and minimum RTPs to ensure fair gambling, creating opposite incentive structures.
The prize payout structure reveals operational philosophies. State lotteries concentrate prize pools into massive jackpots supporting marketing campaigns—”Millionaire Maker!” promotions attract attention despite astronomical odds. This structure maximizes lottery profit by allocating most prizes to a few huge wins that generate publicity rather than providing reasonable returns to typical players. Casino scratch cards distribute prizes more evenly, offering frequent small wins and moderate-sized top prizes rather than life-changing jackpots that almost nobody wins.
Social equity considerations complicate lottery odds evaluation. State lotteries disproportionately extract money from low-income populations who can least afford losses. Studies consistently show inverse correlations between income and lottery spending—the poorest communities spend largest income percentages on lottery tickets. Combined with abysmal odds, this creates regressive taxation mechanisms where governments profit from extracting money from vulnerable populations through poor-value gambling products.
Price Point Analysis: Do Expensive Cards Really Offer Better Odds?
The widespread belief that higher-priced scratch cards offer better odds contains partial truth but requires nuanced analysis. While statistical correlations exist between price and RTP, the relationship proves less favorable than marketing materials suggest.
Massachusetts Lottery data illustrates typical price-RTP relationships. $1 cards average 67% RTP, $2 cards reach 69%, $5 cards achieve 72%, $10 cards hit 74%, $20 cards approach 76%, and $30 premium cards peak at 78%. This progression shows consistent improvement, but the gains prove modest—spending 30x more per card ($30 vs $1) yields only 11 percentage points better return (78% vs 67%).
The mathematical reality of this improvement matters for practical decision-making. That 11-point RTP improvement means losing $0.22 per dollar wagered on premium cards versus $0.33 per dollar on budget cards—a real but unimpressive advantage. Playing twenty $1 cards ($20 total) versus one $20 card yields similar expected losses, though the experience differs substantially due to variance.
New York Lottery’s data reveals that odds of winning anything actually worsen with some price increases. Their $1 cards offer 1-in-4.71 overall odds, $2 cards drop to 1-in-4.85, $5 cards improve to 1-in-3.82, $10 cards increase to 1-in-3.65, $20 cards reach 1-in-3.21, and $30 cards achieve 1-in-2.88. The progression isn’t linear, and mid-price tickets sometimes underperform cheaper alternatives in overall winning frequency.
Prize concentration explains apparent paradoxes in price-point odds. Expensive cards allocate larger prize pool percentages to top prizes rather than distributing returns broadly. A $30 card might offer 1-in-2.8 odds of winning something, but 80% of wins return less than the $30 purchase price. The improved RTP comes primarily from rare large prizes that most players never win rather than better average returns for typical purchasers.
California Lottery provides illuminating comparative data. Their “$5,000,000 Fortune” $30 scratch card advertises impressive odds and high RTP, but detailed analysis reveals: top prize odds of 1-in-3,069,600, second prize ($10,000) at 1-in-767,400, and third prize ($1,000) at 1-in-153,480. Meanwhile, 72% of the winning tickets return exactly $30 (breaking even) or $40-60 (minimal profit). The “improved odds” benefit almost exclusively goes to extremely rare large prize winners.
Digital casino scratch cards demonstrate different price-RTP dynamics. Online games typically maintain consistent RTPs regardless of stake selection—a game offering 95% RTP at $0.50 per card provides identical 95% return at $10 per card. This differs from lottery products where physical printing and distribution costs create economy of scale advantages for expensive cards. Digital operators face negligible marginal costs whether cards cost $0.10 or $100.
The session-cost analysis reveals practical implications. Playing one hundred $1 cards ($100 session cost) at 67% RTP expects $67 return and $33 loss. Playing five $20 cards ($100 session cost) at 76% RTP expects $76 return and $24 loss. The premium cards save $9 in expected losses, but provide only five playing experiences versus one hundred. Many players value entertainment duration over slight RTP improvements.
Psychological pricing mechanisms influence card selection independent of mathematical value. The $19.99 price point creates illusions of significantly cheaper than $20, despite one-cent differences. The $5 price point attracts buyers as feeling meaningful but affordable. These pricing strategies exploit behavioral economics principles rather than reflecting actual value differences.
The breakage phenomenon particularly affects expensive cards. “Breakage” refers to unredeemed winning tickets—players lose cards, forget to check them, or fail to claim prizes before expiration deadlines. Expensive cards create higher absolute breakage amounts—a lost $30 winning card represents more unredeemed value than a lost $1 card. Lottery organizations profit from breakage, creating institutional incentives for complex rules and short redemption windows.
Volume players should almost certainly favor cheaper denominations despite inferior per-card RTPs. The reduced variance from playing many cheap cards versus few expensive cards provides more predictable outcomes approaching theoretical expectations. Additionally, the entertainment value per dollar generally favors volume—experiencing one hundred quick $1 plays provides more entertainment minutes than five $20 plays, even if expected losses exceed those from premium cards by $5-10.
Digital vs Physical: How Online Scratch Cards Stack Up
The digital revolution transformed scratch card economics, creating products dramatically different from physical lottery tickets despite surface similarities. Understanding these differences proves essential for value-conscious players.
Online casino scratch cards typically offer 85-96% RTP compared to 60-75% for physical lottery tickets—a 15-25 percentage point advantage representing enormous practical differences. Bet365’s instant-win games average 94% RTP, 888casino’s scratch cards range from 90-95%, and specialized scratch card sites like PrimeScratchCards offer games exceeding 95% RTP. These returns rival slot machines and exceed most physical lottery products by massive margins.
The cost structure explains digital advantages. Physical lottery scratch cards require specialized printing with security features preventing fraud and counterfeiting. Distribution networks involve warehousing, transportation, and retailer stocking. Retail commissions typically consume 5-6% of gross sales. Prize claims require validation infrastructure and administrative processing. These costs accumulate to 25-35% of gross revenue before prize payout consideration.
Digital scratch cards eliminate these costs almost entirely. After initial software development, marginal costs per game approach zero. No printing, no distribution, no retail commissions. Automated systems handle purchases, outcome generation, and prize payment without human intervention. These savings allow operators to allocate 90-95% of revenue to prizes while maintaining profitability, compared to 60-70% allocations in physical systems burdened by operational costs.
The instant payout difference significantly advantages digital platforms. Physical lottery prizes under $599 typically get paid immediately at retailers, but larger prizes require visiting lottery offices, submitting claim forms, and waiting days or weeks for payment. Digital platforms credit winnings to player accounts within seconds of symbol revelation, enabling immediate replay or withdrawal. This frictionless prize access provides substantial player experience advantages.
Verification requirements differ dramatically. Physical lottery winners of substantial prizes face identity verification, tax withholding, and sometimes mandatory publicity as lottery winners. Digital casino winners undergo similar verification for large withdrawals, but thresholds typically start at $2,000-5,000 rather than $600 for physical lotteries. The higher thresholds enable more wins to process automatically without manual review.
Game variety heavily favors digital platforms. The Michigan Lottery offers approximately 60 different scratch card games simultaneously—impressive for physical systems but limiting compared to digital alternatives. Bet365 offers 200+ instant-win games, 888casino provides 150+ titles, and smaller operators still typically offer 50-100+ games. This variety allows player preference matching impossible in physical retail environments.
The play experience differences prove substantial. Physical scratching provides tactile satisfaction that early digital games failed to replicate. Modern mobile scratch cards with touchscreen swiping and haptic feedback now approximate physical sensations, though purists still prefer actual latex coating scratching. Desktop digital cards using mouse-clicking remain inferior experientially despite superior mathematical odds.
Minimum stake flexibility advantages digital platforms enormously. Physical lottery scratch cards typically cost $1-30 with limited denomination options. Digital games accept stakes from $0.10 to $100+ per game, allowing precise bankroll management. Players can adjust risk levels instantly without purchasing different physical products. This flexibility particularly benefits casual players seeking low-risk entertainment.
Maximum win potential typically favors physical lottery scratch cards offering multi-million dollar jackpots. Digital scratch cards rarely exceed $250,000-500,000 maximum prizes, with most topping out around $100,000. This reflects operator risk management—online casinos face actual instant payout obligations, while lotteries can structure large prizes as annuities paid over decades. Players seeking life-changing wins should favor lottery products despite poor overall odds; those wanting reasonable return rates should choose digital alternatives.
Regulation varies dramatically affecting legitimacy and security. State lotteries operate under government authority with explicit fraud prevention and winner protection mandates. Digital operators hold gaming licenses from jurisdictions like Malta, Gibraltar, Curacao, or UK Gambling Commission. While legitimate licensed operators provide fair games verified by independent testing labs, unlicensed or poorly-regulated digital operators may offer rigged games. Players must verify operator legitimacy before playing.
The availability differences create practical implications. Physical lottery scratch cards sell during retail business hours in specific geographic locations. Digital scratch cards remain available 24/7/365 from any internet-connected device. This constant availability increases convenience but potentially enables problematic gambling by removing natural stopping points created by limited retail access.
Social considerations affect platform choice. Physical lottery tickets integrate into social rituals—gifting, group purchasing, shared scratching experiences. Digital scratch cards remain predominantly solitary activities despite social features like leaderboards and chat functions. Players valuing social gambling experiences should favor physical cards; those prioritizing mathematical value should choose digital alternatives.
The Hidden Truth About Jackpot Probability and Overall Returns
Massive jackpot promotions dominate scratch card marketing, but analyzing top prize probability versus overall return reveals uncomfortable truths about how prize structures manipulate player perception while extracting maximum profit.
The PowerBall comparison illustrates jackpot probability realities. The PowerBall lottery offers 1-in-292,000,000 odds for the jackpot—absurdly remote but honestly disclosed. Many scratch cards hide similarly astronomical odds behind appealing marketing. The “$5,000,000 Spectacular” $30 Massachusetts scratch card offers 1-in-4,260,000 jackpot odds. The “$10,000,000 Colossal Cash” $30 New York card provides 1-in-3,069,600 odds. These probabilities rival major lottery draws while receiving less scrutiny because scratch cards feel like immediate-outcome games rather than long-odds lottery plays.
The prize concentration strategy deliberately manipulates perception. Consider a hypothetical $10 scratch card with 75% RTP and 1 million cards printed. The $10 million gross revenue allocates $7.5 million to prizes. Prize structure Option A: distribute prizes relatively evenly with a $500,000 top prize and thousands of $50-5,000 prizes. Option B: offer a $5 million top prize with fewer and smaller secondary prizes. Both maintain 75% RTP, but Option B creates marketing opportunities—”Win $5 Million!”—despite 99.99% of players receiving worse returns than Option A.
Data from Texas Lottery illustrates this manipulation in practice. Their “$300,000,000 Golden Riches” $50 scratch card (the most expensive lottery scratch card in America) advertises the massive prize prominently while burying crucial details: only four $300 million prizes exist among 100 million printed cards. The odds of winning anything equal 1-in-2.8, which sounds reasonable until realizing that 68% of wins return exactly $50 (breaking even) and only 0.3% of wins exceed $1,000.
The mathematical expected value reveals jackpot irrelevance for typical players. If a $10 card offers 1-in-3,000,000 odds of winning $3,000,000, that jackpot contributes exactly $1 to the card’s expected value ($3M divided by 3M cards). The remaining prizes must provide the other $6.50 of the card’s $7.50 expected return (75% RTP). For 99.9997% of players who never win the jackpot, only that $6.50 from secondary prizes matters—the jackpot is marketing illusion rather than meaningful value.
Progressive jackpot scratch cards introduce additional complexity. Some digital scratch card systems pool small percentages of each purchase into growing jackpots, similar to progressive slot machines. These systems can offer positive expected value when jackpots grow sufficiently large—theoretically creating +EV gambling opportunities. However, calculating true EV requires knowing pool contribution rates, base jackpot values, and secondary prize structures, information operators rarely disclose transparently.
The unclaimed prize problem particularly affects jackpot-heavy games. When prize pools concentrate into few massive wins, the likelihood of those prizes remaining unclaimed increases substantially. The California Lottery reports that approximately $63 million in prizes go unclaimed annually, with significant portions representing large scratch card prizes. This breakage disproportionately affects jackpot-heavy games because players are more likely to discard cards without carefully checking all winning conditions when dozens of complicated rules govern top prize eligibility.
Second-chance drawings exploit unclaimed prize psychology. Many lotteries now implement programs where non-winning tickets enter drawings for additional prizes. These programs encourage players to retain and enter losing tickets, but primarily serve to maintain engagement and create perceived additional value without significantly improving overall returns. The actual expected value from second-chance entries typically adds less than 1% to base RTP.
The “odds of winning” versus “odds of profit” distinction confuses many players. A card advertising “1-in-3 odds of winning!” creates impressions of favorable returns, yet if 90% of wins return less than purchase price, the odds of actually profiting might be 1-in-30. This distinction between nominal winning and profitable winning appears nowhere in marketing materials but dominates actual player experience.
Remaining prize tracking introduces timing considerations. Most lottery organizations publish databases showing how many top prizes remain unclaimed in active scratch card games. Savvy players check these databases to avoid games with claimed top prizes, improving theoretical odds. However, even this strategy provides modest advantages—if a $10 card offered 1-in-2,000,000 jackpot odds and the jackpot is confirmed available, your odds improved from approximately 0% to precisely 1-in-2,000,000. This represents infinite percentage improvement over impossible, but remains meaningless in practical terms.
The retirement timing of scratch card games creates end-game problems. When lotteries discontinue games, remaining cards sold at retail may include zero remaining top prizes—all having been claimed but the game still being sold. Most jurisdictions require prize availability disclosure, but enforcement varies. Players purchasing discontinued games near the end of print runs face impossible jackpot odds not reflected in nominal game odds, creating legal-but-unethical selling of prize-depleted inventory.
Conclusion
The landscape of scratch card odds reveals stark disparities that should inform every purchasing decision. State lottery scratch cards offer the worst gambling odds legally available—typically 60-70% RTP with massive prize concentration into jackpots almost nobody wins. These products function as voluntary taxation mechanisms generating government revenue rather than providing fair entertainment value.
Digital casino scratch cards provide dramatically superior odds—85-96% RTP with more even prize distribution and instant payment. The cost structure advantages enabling these superior returns make digital platforms objectively better values for players prioritizing expected return over physical tactile experience. The 20-30 percentage point RTP advantage represents enormous practical differences in actual playing outcomes.
Price point analysis reveals that expensive cards offer modestly better odds but rarely justify the premium. The 10-15 percentage point RTP improvements from $1 to $30 cards matter mathematically but provide minimal practical benefit compared to entertainment duration and variance reduction from playing many cheap cards instead of few expensive ones. Most players maximize value and enjoyment through volume rather than premium selection.
The hidden truth about jackpot promotions is that they’re mathematical irrelevancies for 99.99%+ of players—marketing tools creating excitement about outcomes with astronomical odds while obscuring the poor secondary prize structures that determine actual player experience. The life-changing jackpots advertised prominently contribute negligible expected value compared to smaller prizes players might actually win.
For value-conscious players, the recommendations are clear: choose digital platforms over physical lottery tickets whenever legal and available; favor games with transparent RTP disclosure over those hiding return information; prefer lower-variance games with frequent smaller wins over jackpot-heavy alternatives unless specifically seeking lottery-style longshot entertainment; and always remember that even the best scratch card odds remain poor compared to most casino games—these should be brief entertainment indulgences, not serious gambling vehicles.
The scratch card industry thrives on information asymmetry—most players never analyze actual odds, compare alternatives, or calculate expected values. This analysis provides the tools for informed decision-making, transforming scratch cards from blind gambles into conscious entertainment choices with clear mathematical understanding of what those entertainment minutes actually cost.